Thinknx Portal
-
Introduction
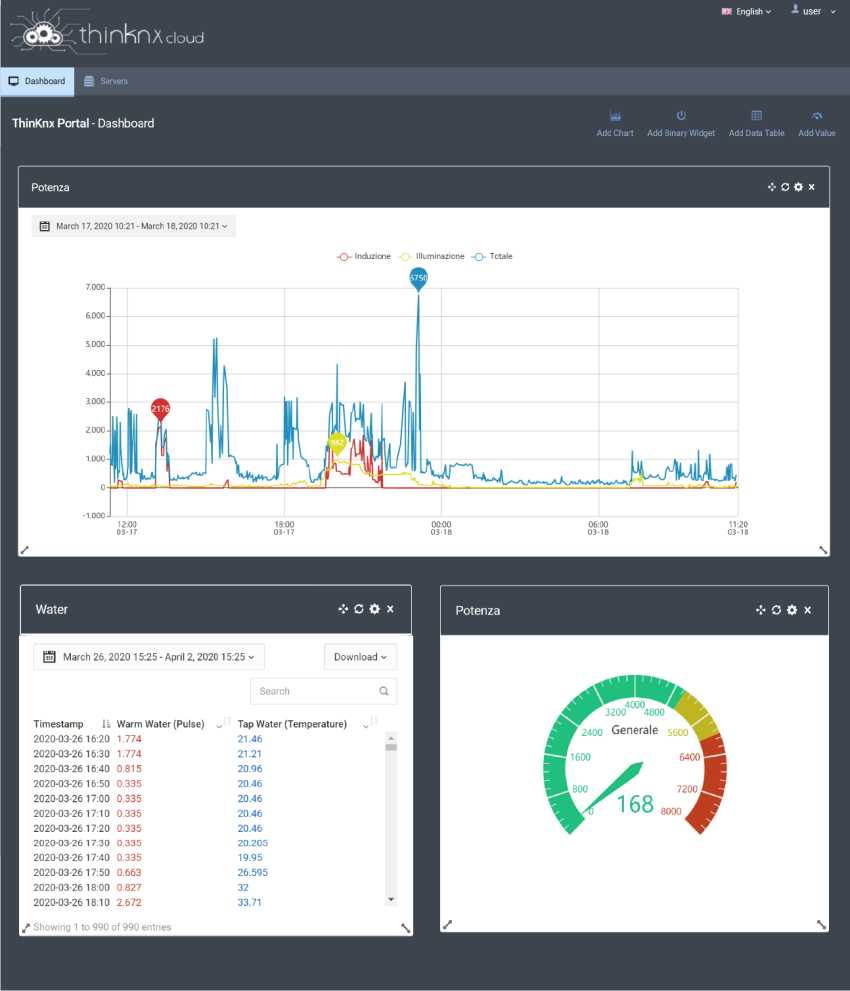
Thinknx Portal is a tool provided by Thinknx Cloud dedicated to system integrators as well as end-users. Its main goal is to monitor and control single installations as well multiple ones such as multi-branch retail stores or companies, clusters of villas or chain hotels. It allows all the installed servers to be virtually connected regardless of their physical location, and controlled from a centralized user interface.
In addition to the servers page, where users can view the status of the connected devices and all their related information, they also have access to a customizable dashboard that groups data into charts and tables which can be filtered according to the desired time frame. Additionally, individual values can be monitored and modified should the need arise.
To access the portal, go to http://data.thinknx.eu/portal. If you are already a user, log in using your known credentials. Otherwise, click on “Create an account” to create your account.
Figure 1: Thinknx Portal
Create an account
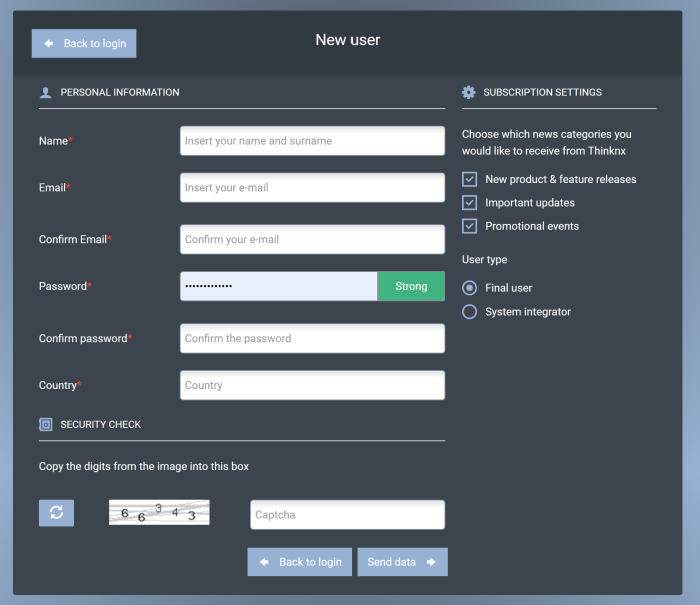
Clicking on “create an account” will redirect the user to a new page to register. The user must enter all the required information, and can subscribe to Thinknx Newsletter by selecting the desired topic. It is also possible to select the type of user between “Final User” or “System Integrator. Once the data are sent, a confirmation email will be received by the user to verify the process.
Figure 2: Thinknx Portal
Linking a Thinknx server to the Portal account
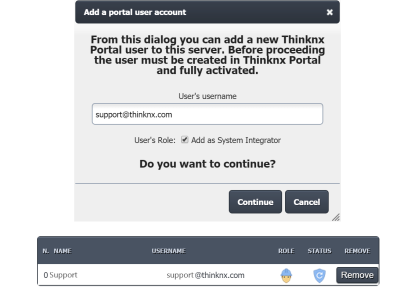
To view and monitor a server from the Portal, one additional step is required by the administrator of the site. From the server's web page, go to Server –> Thinknx Cloud. Scroll down to the bottom of the page to reach the “Thinknx Portal users” section. Click on “associate a user” and enter the user's email address and role. Once added, the user will show up in the table, with a “Pending confirmation” status. To activate it, the user will have to accept this connection when signing in on the portal.
Figure 3: Linking a user to the Portal
Servers
When accessing the Servers page from the Portal, a list of all the connected servers will be available for the user. For each server, the user will be able to view the server's name, serial number, location if available, and all the activated licenses. Some parameters can also be edited such as the name and the coordinates.
Figure 4: Thinknx Servers
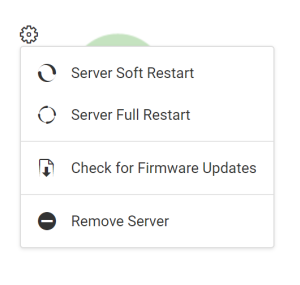
Clicking on the settings icon on the top left side of the server's image will allow the user to send the below commands:
- server soft reboot
- server hard reboot
- check for firmware update on the server
Figure 5: Server Commands
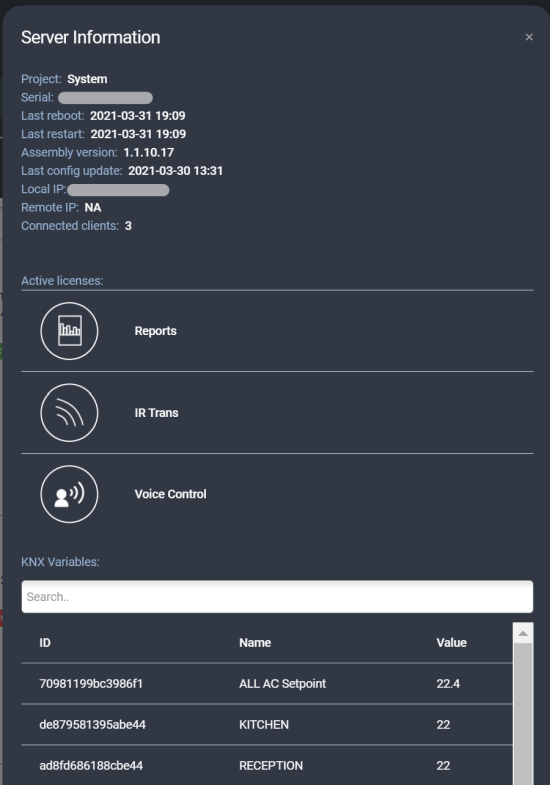
For more information regarding the server, click on the button “View More” to the right. A popup will open allowing the user to view all the available information on the server, as well as a table showing the KNX variables configured on the server and their actual status.
Figure 6: Server Information
Under the servers list, a world map is available to view the location of all the servers, in case their coordinates have been configured correctly from the project or the Portal.
Figure 7: Server Location
Dashboard
Once the Portal user has been linked to one or more servers, it is now possible to configure some widgets on the Dashboard. The available widgets are:
Figure 8: Portal Widgets
Add Chart
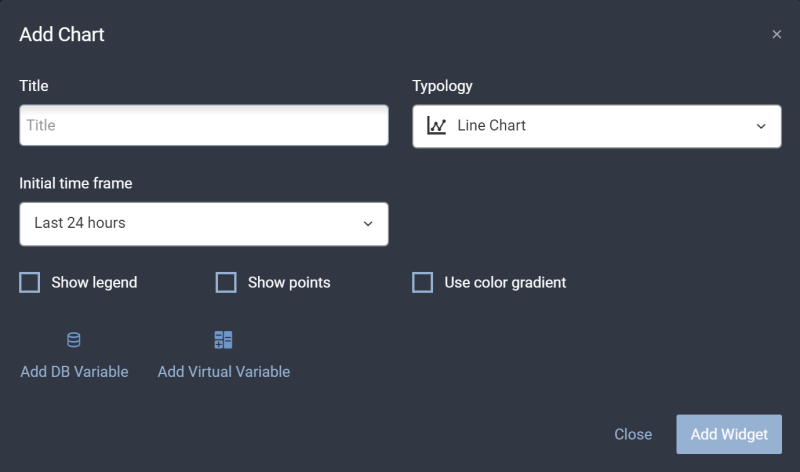
The below parameters are available to configure when adding a chart:
- Title name of the chart
- Typology type of chart. It is possible to choose between Line Chart, Bar Chart, or Pie Chart.
- Initial time frame to start drawing the chart.
- Show Legend enable/disable.
- Show Points only visible if Line Chart is selected as Typology allows to hover the mouse on multiple points on the chart to indicate the exact date and value.
- Use Color Gradient only visible if Line Chart is selected as Typology allows to show the chart as a line with a gradient color filling the area.
Figure 9: Portal Add Chart
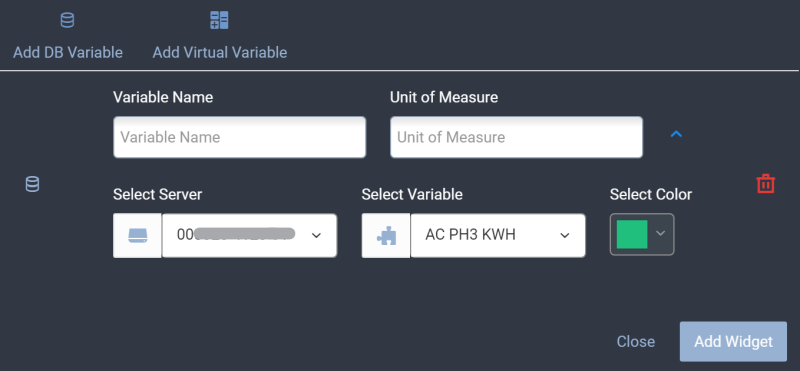
Once the general parameters have been configured, the user can start adding the chart variables. Two options are available:
- Add DB Variable allows the user to show a value from the database configured inside the Configurator.
- Variable name name of the DB variable.
- Unit of Measure to show on the chart.
- Select server allows to choose the server where the desired variable is saved.
- Select variable allows to select the desired DB Variable related to the selected server.
- Select color color of the DB variable selected.
Figure 10: Chart DB Variable
Multiple variables can be added to the same chart.
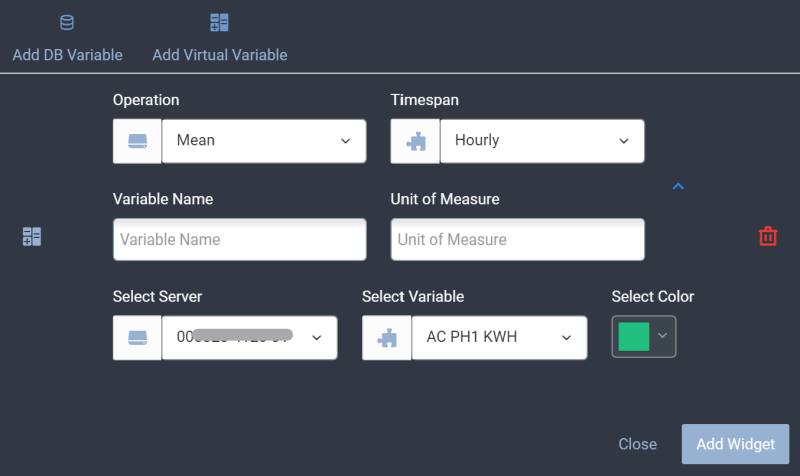
- Virtual Variable:
- Operation allows the user to choose between Sum or Mean of two consecutive values.
- Timespan allows to choose between hourly, daily, weekly or monthly.
- Variable name name of the DB variable.
- Unit of Measure to show on the chart.
- Select server allows to choose the server where the desired variable is saved.
- Select variable allows to select the desired DB Variable related to the selected server.
- Select color color of the DB variable selected.
Figure 11: Chart Virtual DB Variable
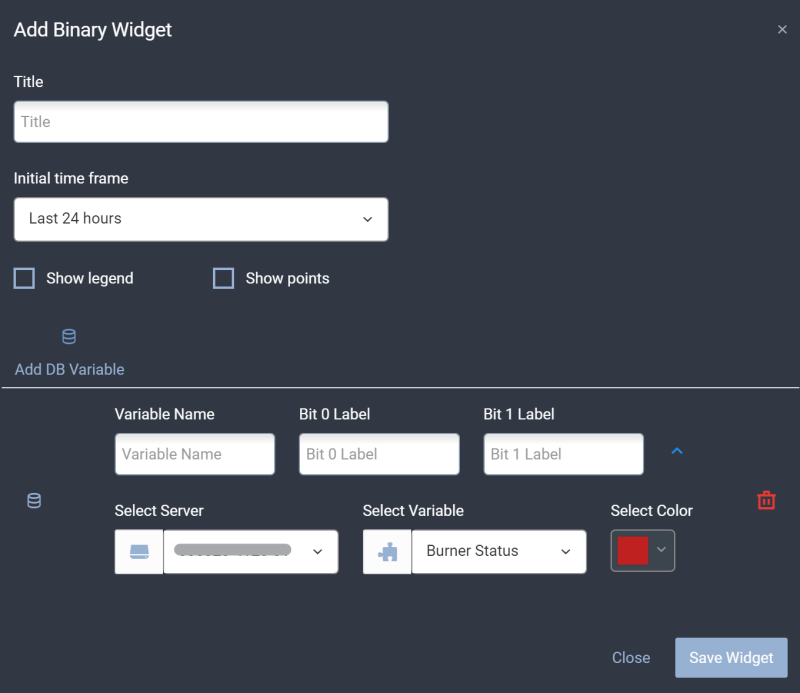
Add Binary Widget
This widget is specifically made for binary values to be displayed as a step chart. The binary values must be saved in a Cloud database. Multiple values can be added on the same widget. When adding a binary widget, the below parameters are available:
- Title name of the chart
- Initial time frame to start drawing the chart.
- Show Legend enable/disable.
- Show Points allows to hover the mouse on multiple points on the chart to indicate the exact date and value.
After clicking on “Add DB Variable”, the below parameters are available:
- Variable name name of the DB variable.
- Bit 0 Label label for when the value received is 0.
- Bit 1 Label label for when the value received is 1.
- Select server allows to choose the server where the desired variable is saved.
- Select variable allows to select the desired DB Variable related to the selected server.
- Select color color of the DB variable selected.
Figure 12: Add Binary Widget
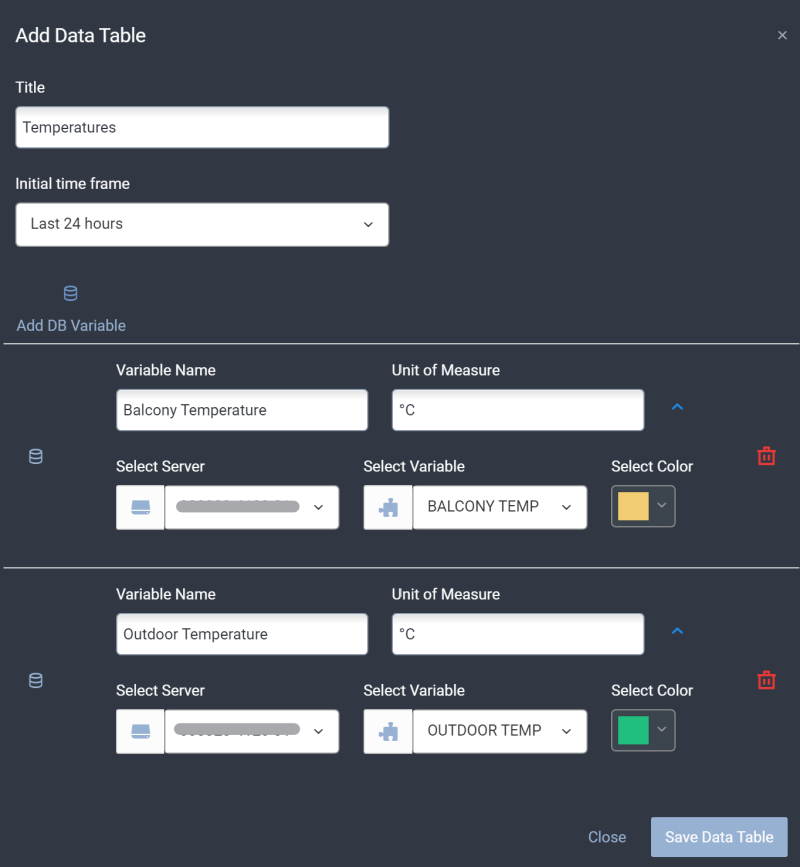
Add Data Table
This widget allows to create a table of different DB variables listed by time. The available parameters are:
- Title name of the table.
- Initial time frame to start drawing the table.
After clicking on “Add DB Variable”, the available parameters are:
- Variable Name name of the DB Variable.
- Unit of Measure
- Select server allows to choose the server where the desired variable is saved.
- Select variable allows to select the desired DB Variable related to the selected server.
- Select color color of the DB variable selected.
Figure 13: Add Table
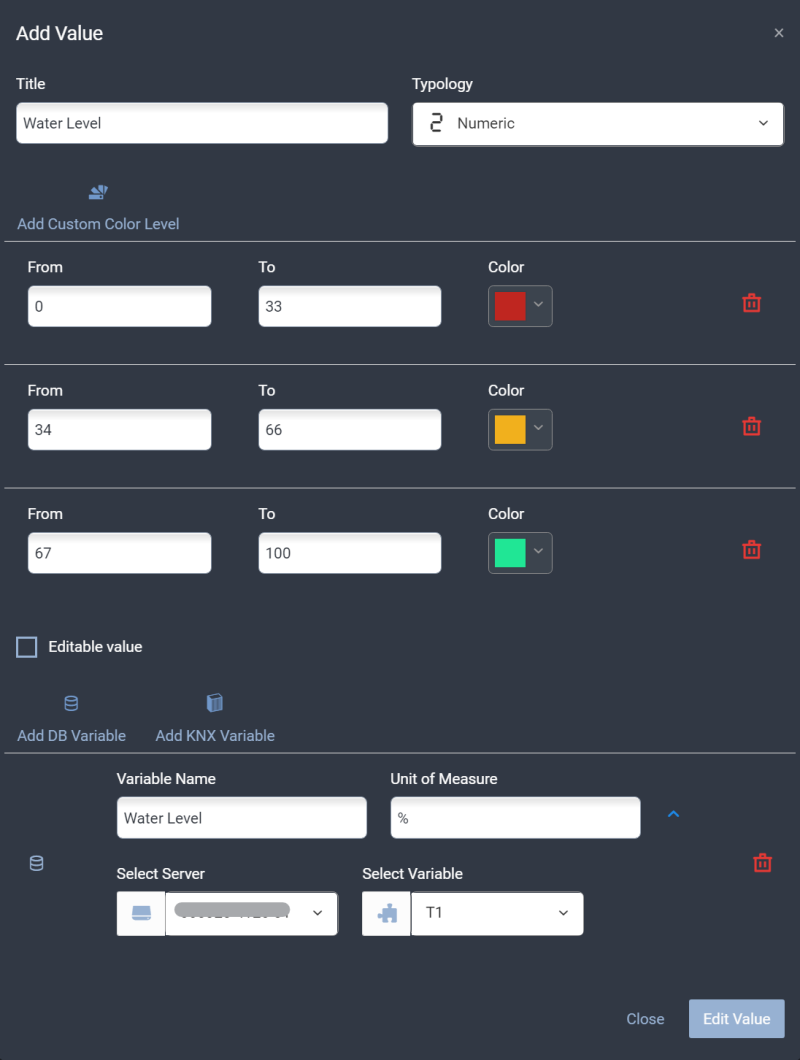
Add Value
The Value widget is used to read the value from a DB variable or KNX variable. It can be visualized as numeric value or as gauge. Custom color ranges can be configured according to the value received. The available parameters for this widget are:
- Title name of the Value
- Typology can be “numeric” or “gauge”.
- Add Custom Color Level to configure the color depending on the value range. For each range, the available parameters are:
- From start of value range.
- To end of value range.
- Color defines the color for this range.
Editable value allows the sending of data to the value. Can be enabled/disabled.Add DB Variable- * Variable Name name of the DB Variable.
- Unit of Measure
- Select server allows to choose the server where the desired variable is saved.
- Select variable allows to select the desired DB Variable related to the selected server.
Add KNX Variable* Variable Name name of the DB Variable.Unit of MeasureSelect server allows to choose the server where the desired variable is saved.Select variable allows to select the desired DB Variable related to the selected server.Figure 14: Add Value
Account Settings
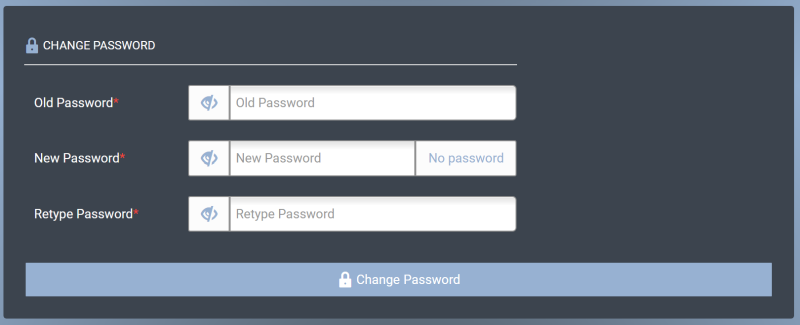
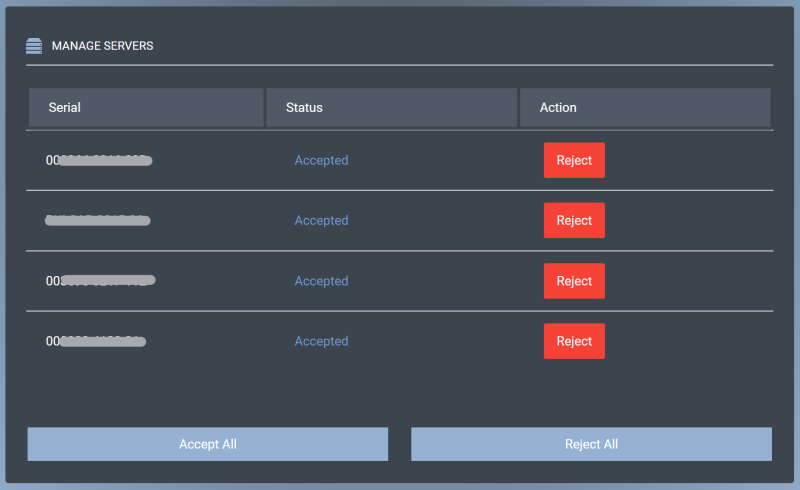
Logged-in users are able to edit their personal information by clicking on their name at the top right corner and accessing the Account Settings page. They can also subscribe to other categories in the newsletter, change their user type, as well as their password. the last section of the page is dedicated to all the servers linked to the portal user. They can be rejected or accepted in case they were pending confirmation.
Figure 15: Edit Information
Figure 16: Change Password
Figure 17: View Linked Servers
- portal.txt
- Last modified: 2021/04/11 10:38
- by ingrid
